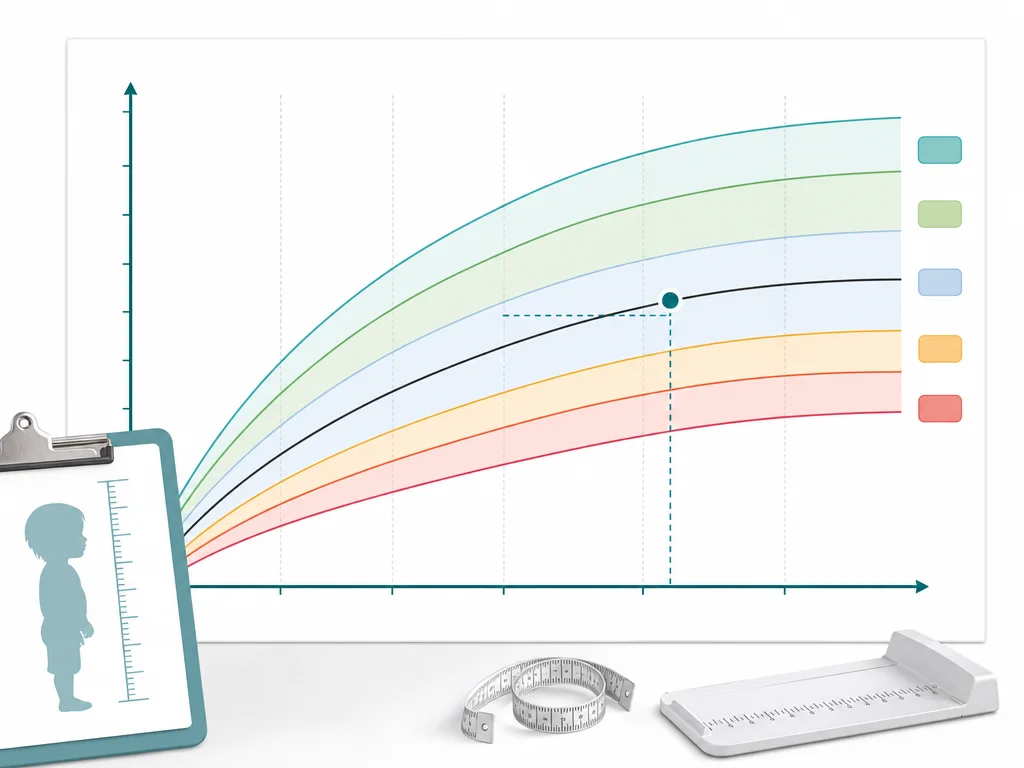
What a Z-score means
A Z-score describes how far a measurement is from the reference median. A value close to zero is near the middle of the reference distribution. Negative values mean the measurement is below the median, and very low values can signal moderate or severe risk depending on the indicator.
The useful point is not the number by itself. The indicator matters: weight-for-age, height-for-age and weight-for-height answer different questions.
Why the calculator uses multiple indicators
A child can be low in weight for age because of chronic growth delay, acute weight loss or both. Height-for-age helps identify stunting, while weight-for-height helps identify wasting. MUAC adds another quick acute malnutrition screen.
How to explain this to caregivers
Use simple wording: the chart compares today's measurement with children of the same age and sex in a reference standard. If the value is far below the normal band, it is a reason to recheck and speak with a health worker.
Why a single cutoff is not enough
A child growth question often starts with a single number: is this weight normal, is this height low, or is this MUAC dangerous? Z-scores make the answer more careful because they compare the measurement with age and sex context. The same weight can mean different things for a younger child and an older child.
This is why a serious calculator page should not present one universal height or weight rule. It should help users understand that screening bands exist to guide attention. The result becomes a conversation starter with a trained worker, not a label that follows the child.
Moderate and severe signals
In many growth references, values far below the median are treated as moderate or severe signals depending on the indicator. The exact program response depends on local guidance, but the plain-language meaning is simple: the farther below the reference band, the more carefully the child should be reviewed.
A moderate signal should not be ignored just because the child looks active. A severe signal should not be delayed while a caregiver searches for more calculators. Re-measure to rule out obvious mistakes, then seek direct guidance when the result remains concerning.
How charts, Z-scores and PDFs work together
Charts are useful for teaching because they show a line or band. Z-scores are useful for interpretation because they show distance from the reference. PDFs are useful for training and outreach because they can be printed, cited and shared offline. The site uses all three because the audience includes caregivers, field workers and educators.
The internal links from this page to the calculator, height-weight chart and stunting/wasting explainer are designed to reinforce one focused topic: child growth screening. That is a stronger SEO signal than publishing unrelated calculator pages just to chase traffic.
Measurement quality still comes first
A precise formula cannot fix a bad measurement. Wrong age, rounded height, old weight, thick clothing or a moving child can all change interpretation. Before worrying about a Z-score, make sure the input is trustworthy.
If the result is unexpected, repeat the measurement and write down the date. If the result remains low or appears with illness, poor appetite, swelling or visible wasting, speak with a trained health worker.
Example interpretation path
Imagine a child whose weight-for-age looks low. The first question is whether age was entered correctly. The second is whether height is also low. If height-for-age is low, the pattern may point toward longer-term growth delay. If weight-for-height is low, the pattern may point toward wasting or recent weight loss. If MUAC is low, acute malnutrition screening becomes more urgent.
This example shows why the calculator does not simply say good or bad. It separates the indicators so the next step is clearer. Searchers who only want a number still get a number, but users who need understanding can follow the explanation without leaving the site.
How Z-score content helps topical authority
The latest research showed that stronger independent sites do not rely only on the phrase Poshan Calculator. They build surrounding pages on Z-score, stunting, height-weight chart, PDF resources and food or growth education. This Z-score page is part of that supporting layer.
For Google, a calculator backed by explanatory pages looks more complete than a calculator alone. For users, the cluster reduces confusion after a result. For outreach, an explainer page gives public-health bloggers and educators a safer page to cite than a bare calculator form.
What this page deliberately avoids
This page does not publish a medical treatment protocol, does not claim to replace official WHO tables and does not ask users to diagnose a child from a screen. It explains the concept and points users back to measurement quality and direct support when needed.
That restraint is intentional. In health-adjacent topics, overconfident wording can hurt both users and trust. A page that clearly states its limits is more likely to support long-term authority than one that promises certainty.
Terms users may see in results
Median means the middle of the reference distribution. A standard deviation is a way to describe distance from that middle. A negative Z-score means the measurement is below the median for that age, sex and indicator. Moderate and severe bands are used to decide when attention is needed.
Caregivers do not need to memorize the statistics. They need to understand that a very low value is a signal to recheck the measurement and talk to a trained person. The chart on this page is designed to make that idea easier to see.