Indian Child Height and Weight Chart: How to Read It Safely
A height and weight chart can help parents and workers understand child growth patterns, but it only works when age, height, weight and measurement date are correct.
Updated: Indian child height weight chart
Not official. This independent site links to official Poshan Tracker and WHO resources, but it is not a government portal.
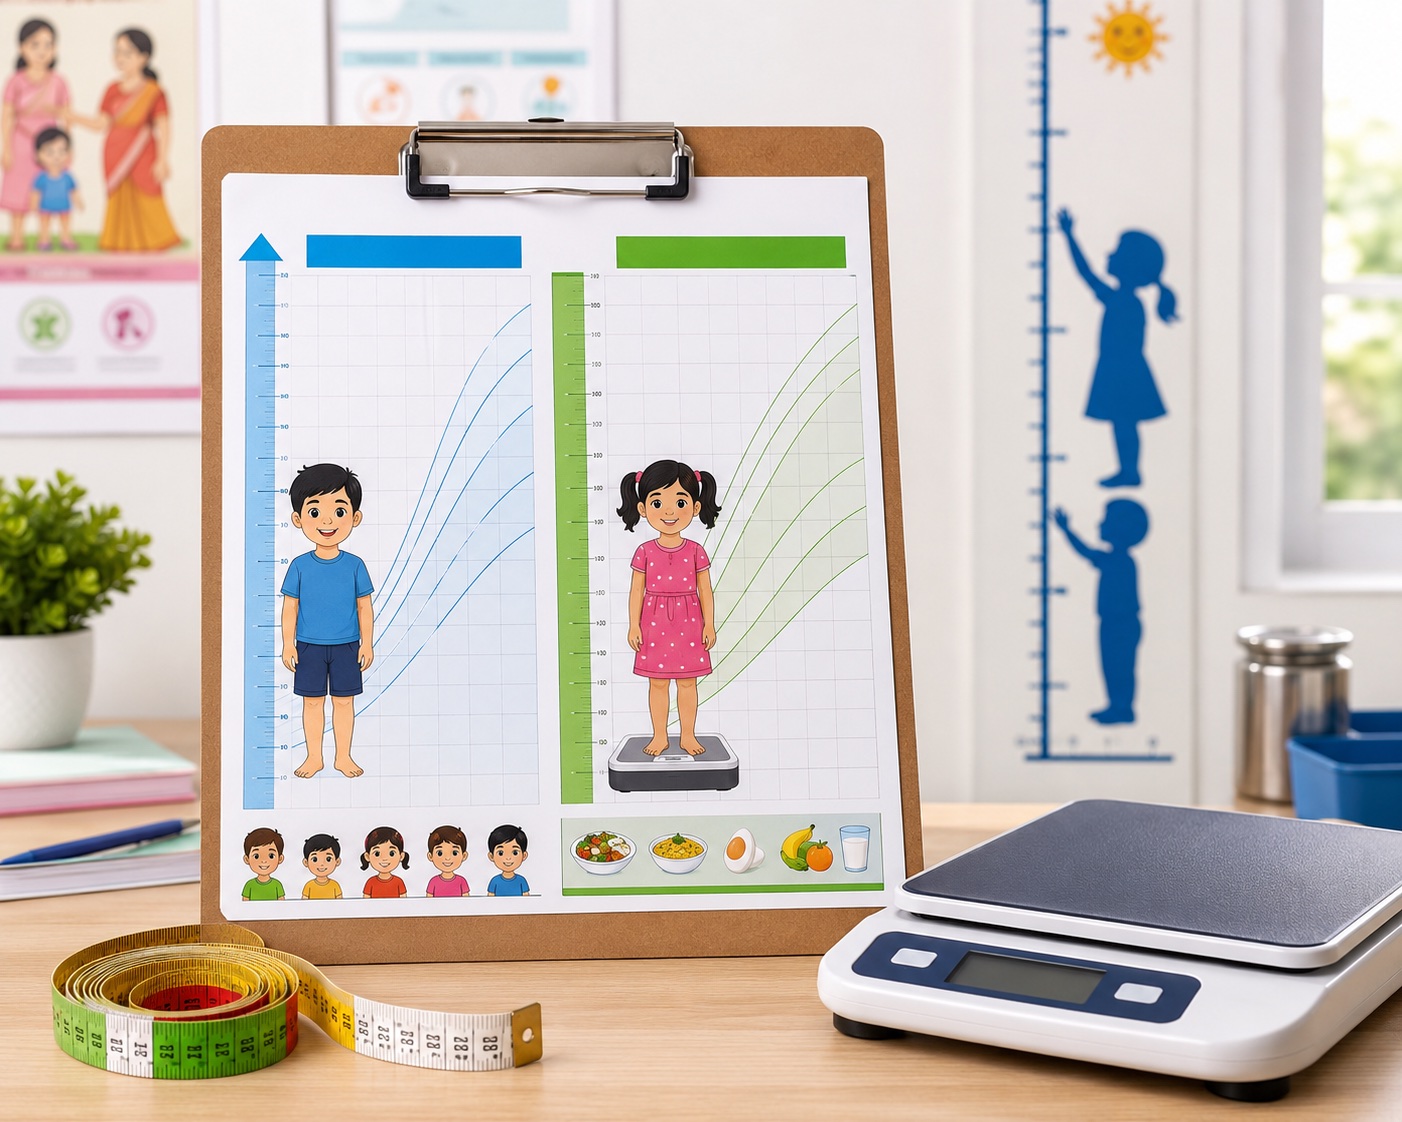
A chart is a reference aid; careful measuring still comes first.
12 months9.6 kg
24 months12.2 kg
60 months18.3 kg
Start with age in completed months
For children under five, one or two months can change the reference comparison. Use date of birth where possible, then record age in completed months on the measurement date.
If age is guessed, the chart may make a normal value look low or a concerning value look less important. This is one reason calculator pages ask for age before they ask for weight or height.
Completed age in months can change how a growth value is interpreted.
Measure before you interpret
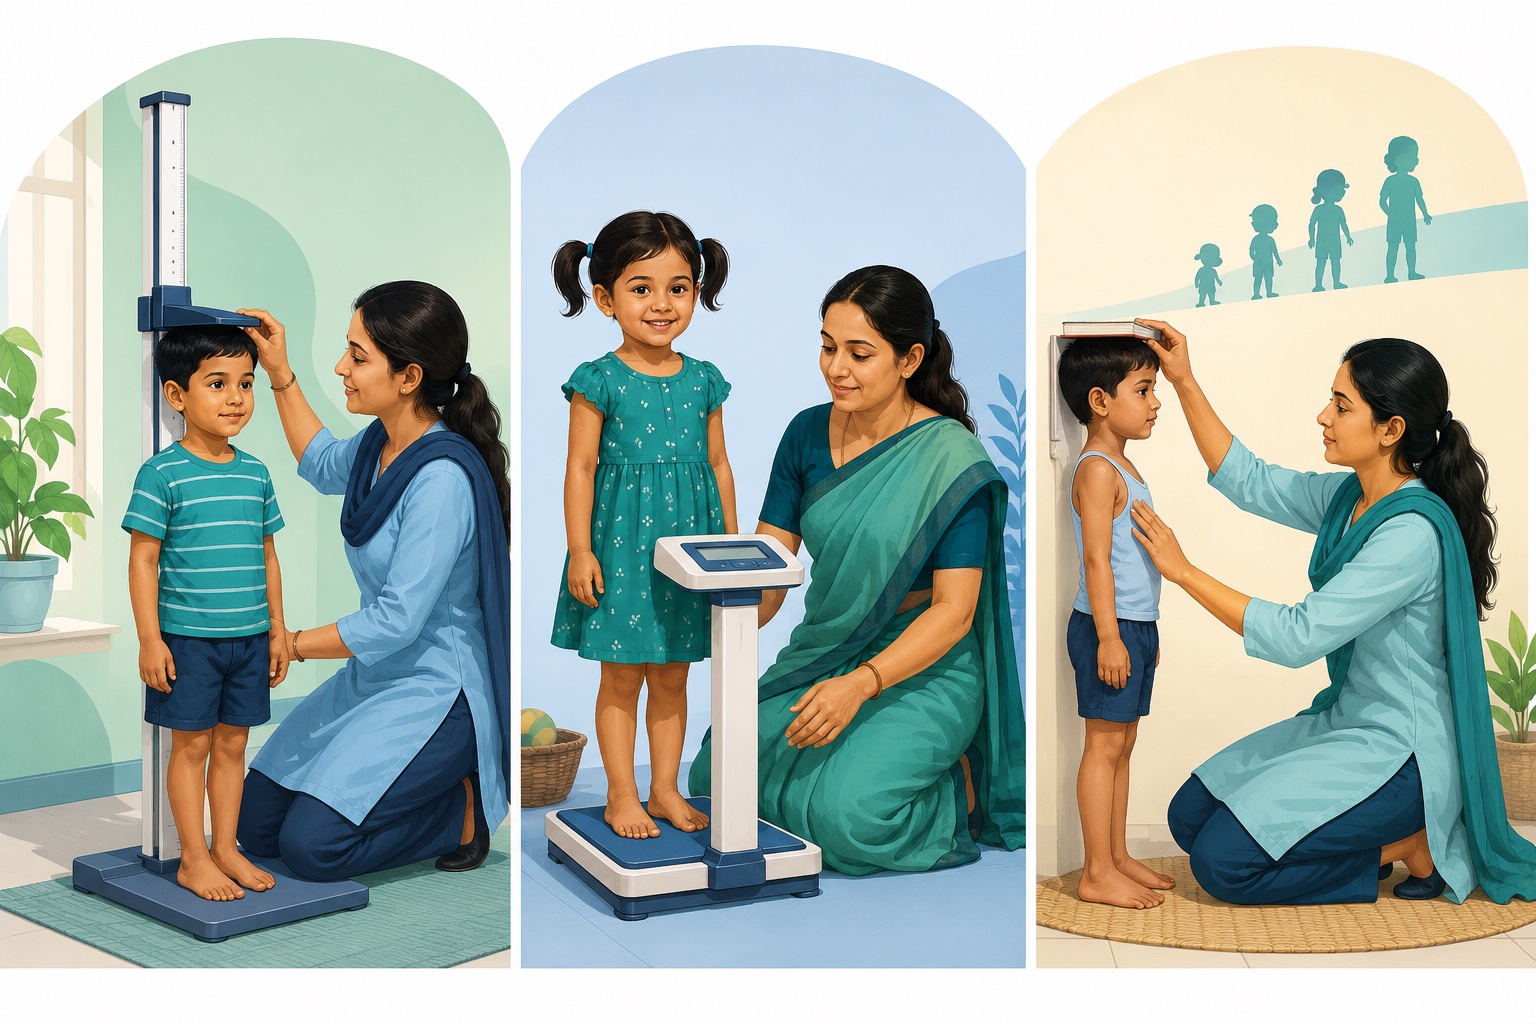
For standing height, remove shoes and keep the child straight against the height board. For younger children measured lying down, use length technique consistently. Weight should be taken on a stable scale with light clothing when possible.
Measurement checks before using a chart
Check
Why it matters
What to do
Age
The chart band changes quickly in early childhood.
Use date of birth and completed months.
Height or length
A small height error can change stunting or wasting interpretation.
Use the right board and remove shoes.
Weight
Heavy clothing or an unstable scale can shift the result.
Use kilograms and recheck surprising values.
Date
Old height with current weight can mislead.
Record every measurement date.
Length, standing height and weight need consistent technique.
Use the chart with the calculator
The chart gives visual context. The Poshan Calculator can compare more than one indicator at the same time. If the chart suggests a low value, enter the measurements into the calculator and compare weight-for-age, height-for-age, weight-for-height and MUAC where available.
For standing height, the child should stand straight without shoes.
What a chart cannot show
A chart cannot show appetite, swelling, illness severity, food access, sanitation, feeding quality or whether the child was measured correctly. It should start a better conversation, not end it.
When a value is repeatedly low or the child has warning signs, bring the dated measurements to a trained health worker. The page, chart and calculator are educational aids, not a replacement for local care.
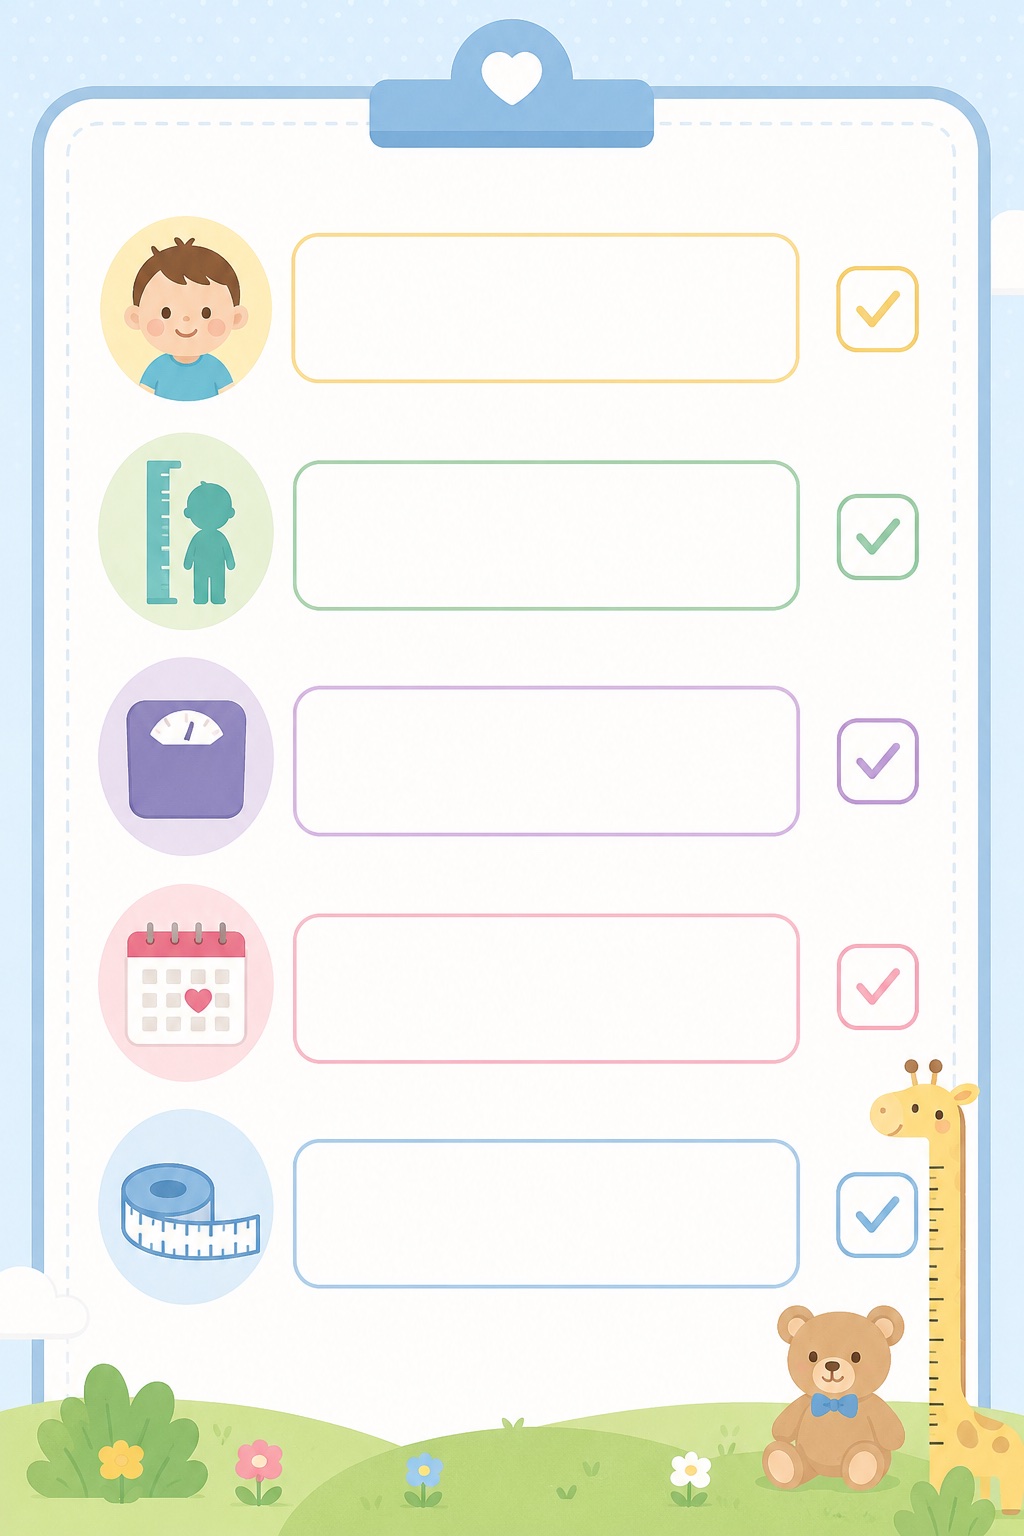
A short checklist prevents many false alarms and missed signals.
Questions
Should I use a chart or calculator first?
Use either as a starting point. The calculator is better when you want multiple indicators together; the chart is useful for visual reference.
Is one low chart reading enough to decide a problem?
No. Recheck age, height, weight and date, then look at repeated records and symptoms.
Can I use this for newborns?
Use official newborn and infant guidance where available. For young infants, measurement technique is especially important.